App Home Screen
The home screen brings together numeric readings, hive state, and recent events for the selected hive or BeeApiary beehive scales. The app has no separate measurements screen: all available data forms a combined description of the hive.
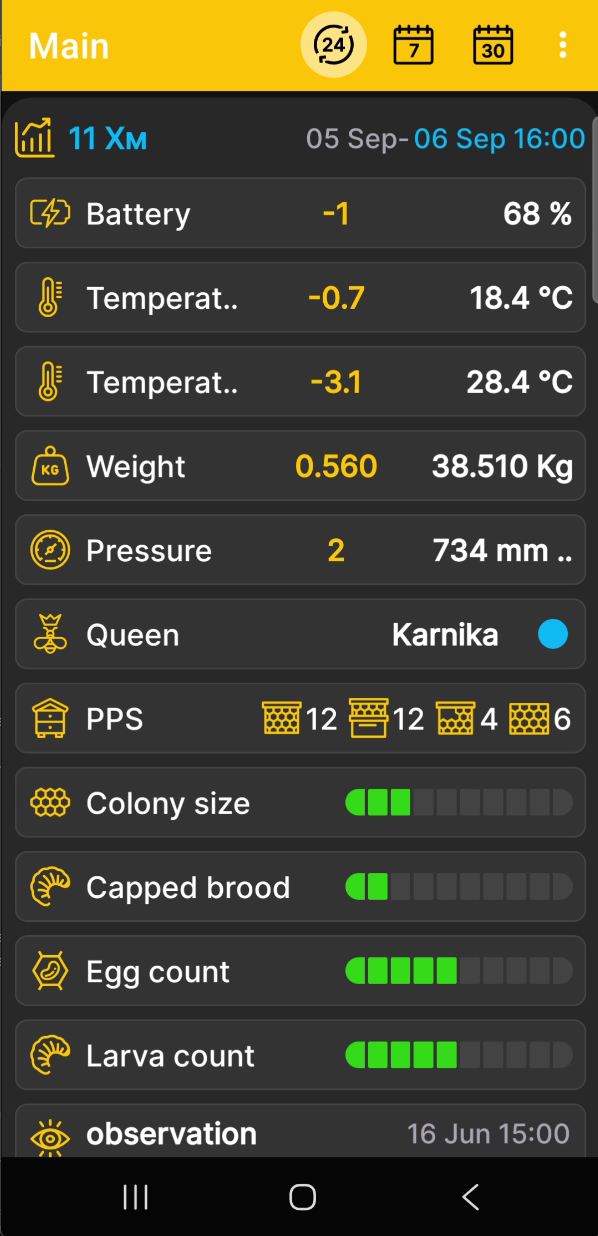
What Appears on the Screen
- the selected hive or BeeApiary hive scales;
- numeric readings for weight, temperature, humidity, pressure, and battery charge when the corresponding data is available;
- hive status, queen, frames, brood, and other profile records;
- the five most recent events recorded by the user.
The available blocks depend on the data, sensors, and information entered for the selected hive.
Tile visibility and order are configured under Select Data and Charts. Numeric values that change over time can also be displayed as charts. A separate field setting is available for the hive state.
Period and Values
The icons at the top of the screen switch the period unit between days, weeks, and months. Tap the corresponding icon repeatedly to select 1, 2, 3, or more days, weeks, or months in sequence.
Tap the date and time at the top of the selected hive panel to choose the end date of the period. For details, see Chart Viewing Period.
For each numeric reading:
- the latest measurement at the end of the selected period appears on the right in white;
- the change, or delta, between the values at the beginning and end of the selected period appears in yellow.
Quick Navigation
Briefly tap the selected hive heading to open the charts. Touch and hold the heading to open data selection and chart order.
- Swipe left to open the hive state, add a new record, or update the current one.
- Swipe right to open events and notes, add a new event, or edit an existing one.